D3 – Resolving Uncaught TypeError:
While practicing on the Sebastian Gutierrez’s D3 and Language R course on DashingD3js.com (BTW a great resource to learn integrating both of these languages) I was stuck at a problem where the console constantly kept giving me the following error:
Uncaught TypeError: Cannot read property ‘line’ of undefined.
The code that I’m talking about looks something like this:
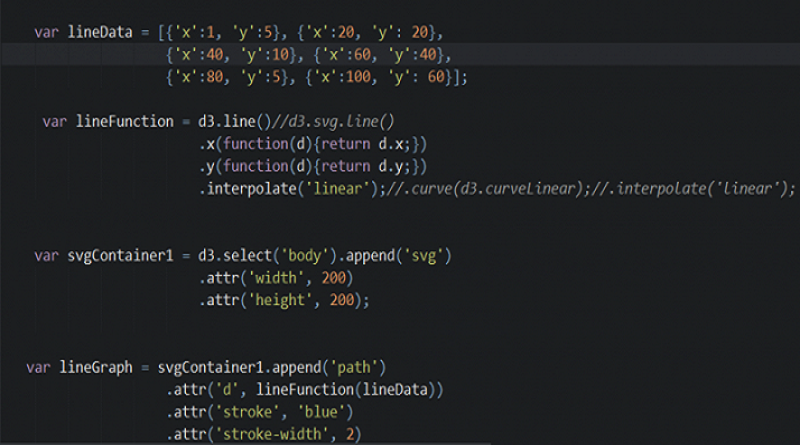
       var lineData = [{'x':1, 'y':5}, {'x':20, 'y': 20},
                       {'x':40, 'y':10}, {'x':60, 'y':40},
                       {'x':80, 'y':5}, {'x':100, 'y': 60}];

       var lineFunction = d3.svg.line()
                          .x(function(d){return d.x;})
                          .y(function(d){return d.y;})
                          .interpolate('linear');

       var svgContainer1 = d3.select('body').append('svg')
                           .attr('width', 200)
                           .attr('height', 200);

       var lineGraph = svgContainer1.append('path')
                       .attr('d', lineFunction(lineData))
                       .attr('stroke', 'blue')
                       .attr('stroke-width', 2)
                       .attr('fill', 'none');
Although, I followed each and every step accurately but still the error keeps popping up and the output wasn’t generating which should have been something like this:

The only result was a blank screen and the console displayed the above error.
So what went wrong?
I decided to search it up on the internet and figured out that the problem lies with the version of D3 I was using.
In the “Head” section, I used the following line of code to callback D3:
<script src="https://d3js.org/d3.v4.min.js"></script>This clearly states that I was using version 4 of D3. So what does the version 4 of D3 has to do with the working of the code?
Well, the line, d3.svg.line() would work only till version 3 and for the fourth version, it has been replaced by d3.line().
The complete transformation from version 3 to version 4 of D3 can be seen from this comprehensive documentation that can be found here: d3/CHANGES.md at master · d3/d3 · GitHub
So all I had to do was to replace d3.svg.line with d3.line.
This should have worked but when I executed the code, still what I could see was a blank white screen. So there must be something wrong as well.
Again, I went to the console to see what secrets it now holds for me and this time, it gave me the following error message:
Uncaught TypeError: d3.line(…).x(…).y(…).interpolate is not a function
Now, this error surely looks more complex than the first one. But if we take a close look, it says, “Interpolate” is not a function.
This line of code looks something like this: .interpolate('linear');
If you are logical, it’s not difficult to deduce that even the interpolate function is not supported by version 4 anymore. So what is the alternative?
The document that I shared showed that I can replace the interpolate function with .curve(d3.curveLinear); and when I applied these changes, Voila…! the code worked.
So if you guys are following the same course that I did and stuck at the same place. Then here is the complete and updated code for you guys:
      var jsonCircles = [
                         {'x_axis': 30, 'y_axis': 0, 'radius': 20, 'color': 'green'},
                         {'x_axis': 70, 'y_axis': 20, 'radius':20 , 'color':'purple'},
                         {'x_axis': 110, 'y_axis': 100, 'radius': 20, 'color':'red'}
                        ];
      var svgContainer2 = d3.select('body').append('svg')
                          .attr('width', 200)
                          .attr('height', 200);

var circles2 = svgContainer2.selectAll('circle') .data(jsonCircles) .enter() .append('circle');
      var circle2Attributes = circles2 .attr('cx', function(d){return d.x_axis;})
                     .attr('cy', function(d){return d.y_axis;})
                     .attr('r', function(d){return d.radius;})
                     .style('fill', function(d){return d.color;});
      var lineData = [{'x':1, 'y':5},
                      {'x':20, 'y': 20},
                      {'x':40, 'y':10},
                      {'x':60, 'y':40},
                      {'x':80, 'y':5},
                      {'x':100, 'y': 60}];

     var lineFunction = d3.line()
                         .x(function(d){return d.x;})
                         .y(function(d){return d.y;})
                         .curve(d3.curveLinear);

     var svgContainer1 = d3.select('body').append('svg')
                          .attr('width', 200)
                          .attr('height', 200);

     var lineGraph = svgContainer1.append('path')
                       .attr('d', lineFunction(lineData))
                       .attr('stroke', 'blue')
                       .attr('stroke-width', 2)
                       .attr('fill', 'none');
I hope this will help you out.


Spitzen Beitrag, gefällt mir echt gut.!
excellent post thanks
Thanks hedge Trimmer. 🙂
magnificent issues altogether, you just gained a emblem new reader. What may you recommend about your publish that you made some days ago? Any certain?